
The 2020 U.S. presidential election was contested like no other federal election, both before and after the votes were cast. Now, months later, the data have been compiled and verified, and we can look back at what happened. This analysis largely ignores the electoral vote even though that’s what determines presidential elections. The popular vote is more interesting in terms of what is happening with individual voters in the States.
Three Major Demographics
This analysis goes beyond the traditional comparison of Republicans versus Democrats to look at the third dominant category—Nonvoters. Nonvoters are individuals who could have voted but, for some reason, did not. They may not have voted because of systemic reasons, like eligibility-requirements, the operation of the polling locations, or intentional and unintentional voter suppression. They may not have voted because of personal reasons, like physical, logistical, schedule, or lifestyle challenges. They may be apathetic. fearful of the government, unprepared for making voting decisions, or convinced that their vote doesn’t matter.
Nonvoters can’t be counted the way voters are. The exact number of voters is known based on the ballots they cast. Nonvoters leave no trail. Their numbers have to be estimated from the population of citizens, including those outside the country, who are over the age of 18 and who are not in prison, on probation, on parole, or ineligible because of a prior felony.
For this analysis of the 2020 election, voter data came from Wikipedia. Nonvoter data came from The United States Elections Project.
Historical Turnout
Turnout is simply the percentage of eligible voters who cast a ballot on election day. Overall turnout in the popular vote has increased by about 10% from 1980 to 2020, as shown in the following graph. However, the change wasn’t strictly uniform. It seems that there was an upward shift after the 2000 election. Perhaps all the news about butterfly ballots and hanging chads in Florida made people aware that our electoral system was in a crisis. Certainly, 2001 brought home the message that elections have consequences.

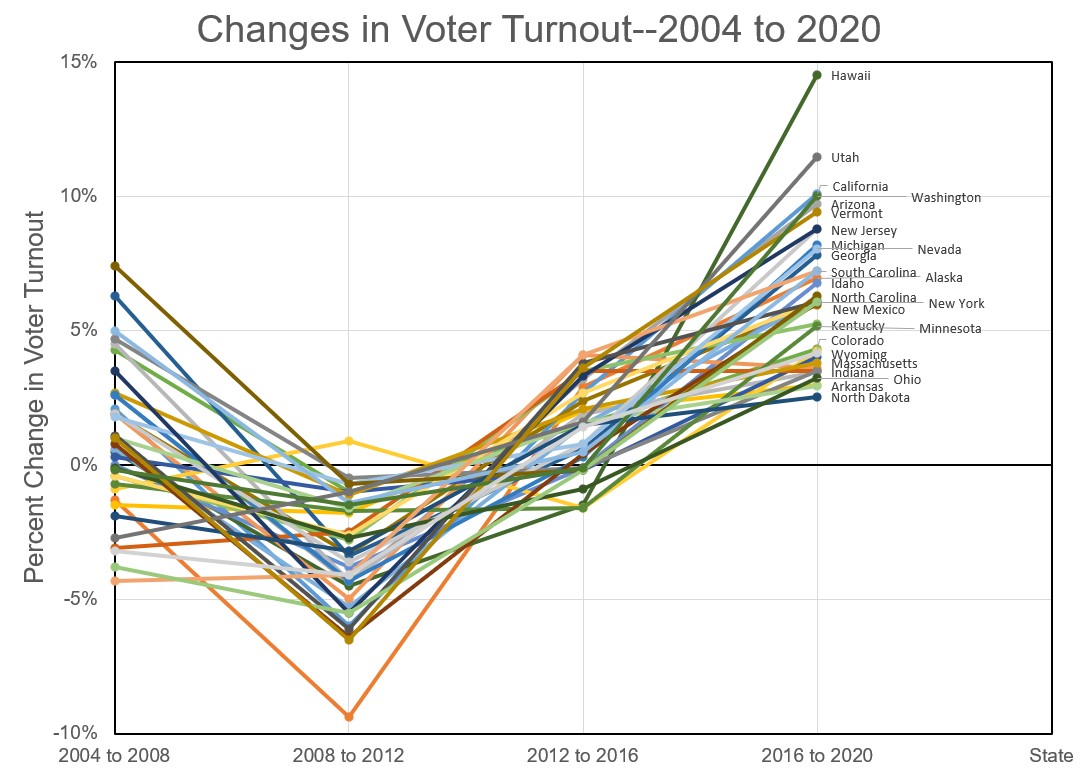
Within the increasing long-term trend in voter turnout are changes attributable to the nature of the political contest for President. Turnout rose to 62% in 2008 for the election of Barack Obama as President. But, turnout dipped to 58% for his second election. The Trump-Clinton contest drew a 60% turnout. After four years of Donald Trump, 68% of the electorate turned out to elect Joe Biden. This pattern is reflected in the turnout statistics for nearly every State, as shown in the following graph of changes in turnout rates.
The 2020 Election
November 3, 2020 was an unremarkable day, other than it being Election Day. The weather throughout the area was mostly dry with mild temperatures in the 60s. Besides Covid-19 restrictions and activities typical before any National election, there were no major events or conditions that would have caused people not to vote. However …
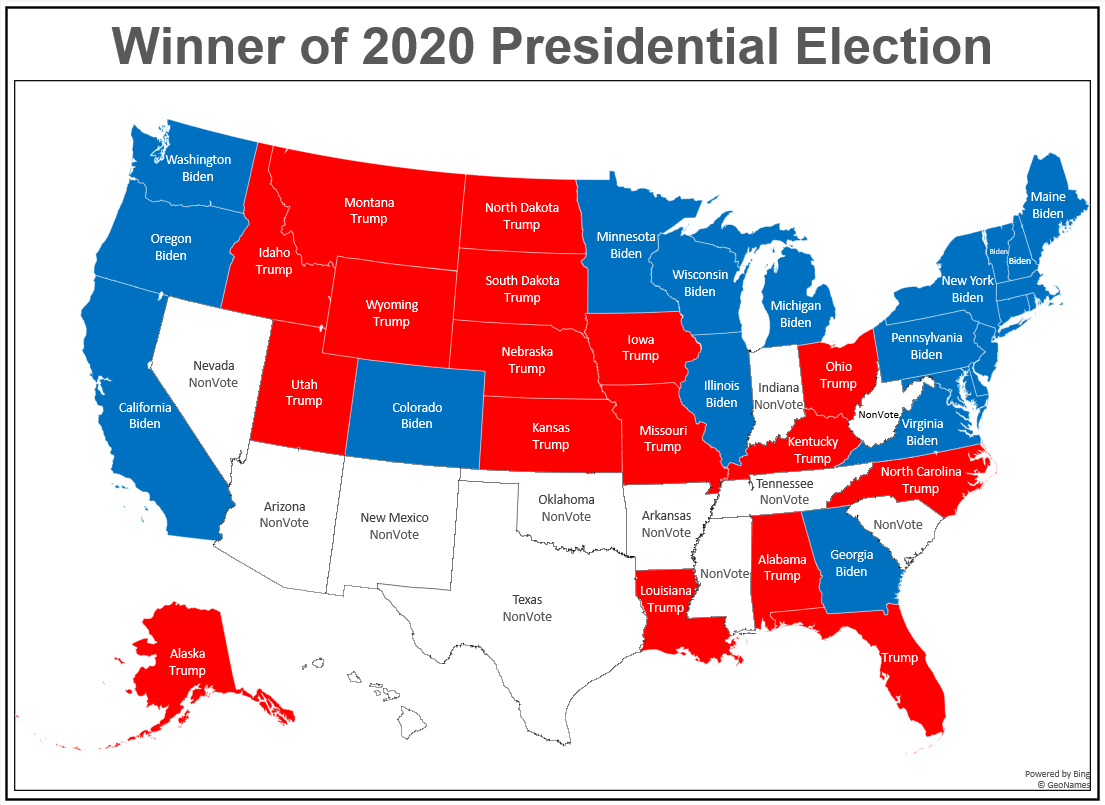
The map of the U.S. at the top of this article depicts the States in which most of the voters voted for Biden (21 States and D.C. in blue) or for Trump (17 States in red). In 12 states, there were more non-votes than votes for either candidate:
- 4 States went to Biden—AZ, HI, NV, and NM
- 8 States went to Trump—AR, IN, MS, OK, SC, TN, TX, and WV
Nine of the States—AZ. AR, IN, MS, OK, SC, TN, TX, and WV—are considered to be Red States. Trump captured all of these Red States except Arizona. Perhaps the most curious aspect of the map, though, is that eight of the States lie south of the 37° N parallel, in the southern third of the country.
So why was non-voting so predominate in this area? Maybe it had something to do with Covid-19, hangovers from Halloween, or football season. Maybe it was related to voter suppression. Or maybe, voters just lost faith in their candidate and didn’t bother to vote. Who knows?
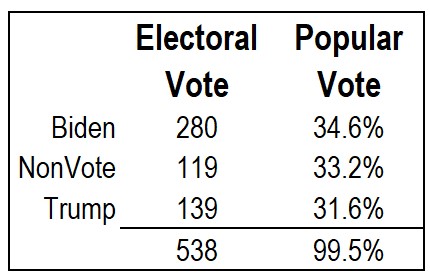
Overall, Biden got the most popular votes and there were more non-votes than votes for Trump. This may show that the electorate was energized but not necessarily by the presidential candidates. If the Democrats had fielded a better-liked candidate or if they had not alienated so many factions, they would have won by a bigger margin. They managed not to lose an election that was theirs to win, like they did in 2016. Trump showed that he was corrupt and immoral, which turned off many voters, but he still represented the conservative ideals of authoritarianism, guns, and hatred of liberals, which is all some people will vote for. Still, it isn’t clear that nonvoters affected the outcome.
And the Winner Is …
So who won? Biden. With or without the non-voters, he won both the popular vote and the electoral vote. That’s a nice change from the elections of 2000 and 2016. And Trump? He came in second in the electoral vote and THIRD in the popular vote. Yes there were more people who didn’t vote than people who voted for Trump.

1 Comment