
Every State has its own recipe for disaster.

When the news reports that a disaster area has been declared you can be sure of two things, they aren’t taking about your teenager’s bedroom and something horrible has happened. You usually know if you’re in a disaster. Things like hurricanes, floods, and wildfires are hard to miss if you live in the affected area. Even droughts, which take months to evolve, are noticeable. But some disasters are sudden and unexpected, like the loss of the Shuttle Columbia and the collapse of the condominium in Surfside, FL. You wouldn’t have known they happened until you saw them reported on the news.
Most disaster declarations are limited in area. Some affect only a city or county in a State. Some disasters may affect several contiguous States, but each State has to be declared a disaster area separately. Every State was declared a disaster area because of the Covid pandemic.
Sometimes disasters affect us remotely, like air pollution from wildfires or shipping delays attributable to transportation accidents. DC, MI, WA, OR, NM, and IL were granted Emergency Declarations in 2005 to support evacuations from Hurricane Katrina, all far away from the actual disaster.
You might be surprised that disaster areas have been declared after some seemingly ordinary events, like water main breaks, power outages, gas leaks, waste dumping, water contamination, viruses, algae, bad fishing, and undocumented aliens. The District of Columbia was declared a disaster area in anticipation of the Inaugurations of Barack Obama in 2009 and Joe Biden in 2021 but not before the inauguration of Donald Trump in 2017.
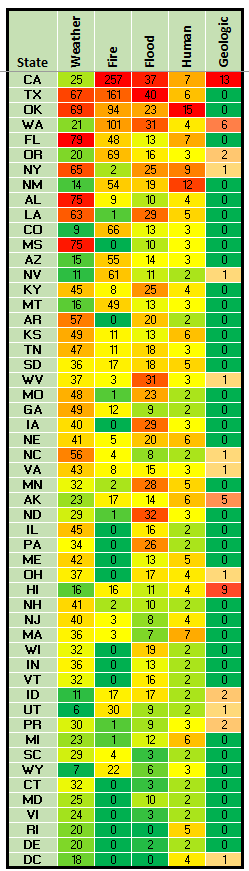
No State is immune from disasters, though some States have more than others. Each State also has a different mix of disasters that they experience. In the heat-map graphic on the left, the States are ranked by the number of times they were declared a disaster area for five categories of causes. Red cells indicate the most declarations for a cause and green cells indicate the fewest declarations for a cause. States at the top of the map tend to have the most declarations and States at the bottom have the fewest declarations. You can’t escape calamity by moving to a nicer neighborhood. But more on this in a minute …
What Is a Disaster Area?
The first legislative act of federal disaster relief in U.S. history followed a fire in Portsmouth, NH in December 1802. The response required an act of Congress and involved providing financial relief to affected Portsmouth merchants for several months.
Over the next seventy-five years, responsibility for disaster relief was assigned to a half dozen different Federal agencies under a variety of legislative actions. The Disaster Relief Act of 1950 established a permanent source of federal disaster relief funds. The Stafford Act of 1988 established the statutory authority for presidential disaster and emergency declarations as well as the resulting federal assistance.
In 1978, Congress created the Federal Emergency Management Agency (FEMA), empowered a year later by President Carter’s Executive Order, to manage Federal disaster relief efforts. Now, to be declared a Federal disaster area, a governor must declare a state of emergency and request that the President respond to the disaster. A Governor’s declaration is not needed if the disaster occurs on Federal property.
For this analysis, 1953 was also an important year. It is the first year included in FEMA’s database of disaster declarations, which includes information on over 4,500 disaster declarations.
Causes of Disaster
What the Federal government has considered to be a disaster has evolved over time. In the 1950s, disasters were almost exclusively flood and weather-related events. Fires were only occasionally considered before the 1980s. Then, they became more significant than floods, comparable in importance to weather-related events. Increases in the cumulative numbers of disaster area declarations by cause are shown in the following graph.

Over the past 70 years, nearly half of the disaster area declarations have been attributable to weather-related events—droughts, freezes, snow storms, ice storms, wind storms, hurricanes, tornados, tsunami, typhoons, and tidal waves. These causes have increased substantially since the 1990s. Fires and floods account for about 30% and 20% of disaster declarations, respectively. Geologic-related causes—earthquakes, volcanoes, landslides—account for only 1% of disasters despite being the mainstay of disaster movies. Human-related causes—infrastructure failures, power failures, explosions, contamination, and terrorism—were as rare as geologic events until Covid caused a spike in disaster declarations in 2020.
States of Disaster
While no State is free of disasters, some States are safer than others. The following graph illustrates the relative frequency of occurrences of disaster-area declarations by State. In the graph, the horizontal axis represents the number of declarations per 1,000 square miles of the State. The vertical axis represents the number of declarations per 100,000 population of the State averaged from 1953 to 2021.
Eight States outside the green divider—RI, DE, VT, WY, ND, SD, MT, and AK—are coded as blue on the accompanying bar graph. These are smaller or less populated States. They tend to have fewer disaster declarations given their size and population.
Eighteen States within the green divider—HI, WA, OR, NM, NV, OK, NE, ID, KS, MS, AR, IL, WV, NJ, CT, MA, NH, and ME—are coded as green on the accompanying bar graph. These States are larger or more populated than the States coded in blue. They tend to have more disaster declarations than the States coded in blue but not as many as the States coded in red.
Twenty-four States within the red divider—CA, UT, AZ, CO, TX, IA, KY, MO, LA, AL, TN, VA, NC, SC, GA, FL, WI, MN, MI, IN, OH, PA, MD, and NY—are coded as red on the accompanying bar graph. These are the largest or most populated States. They tend to have the most disaster declarations given their size and population.
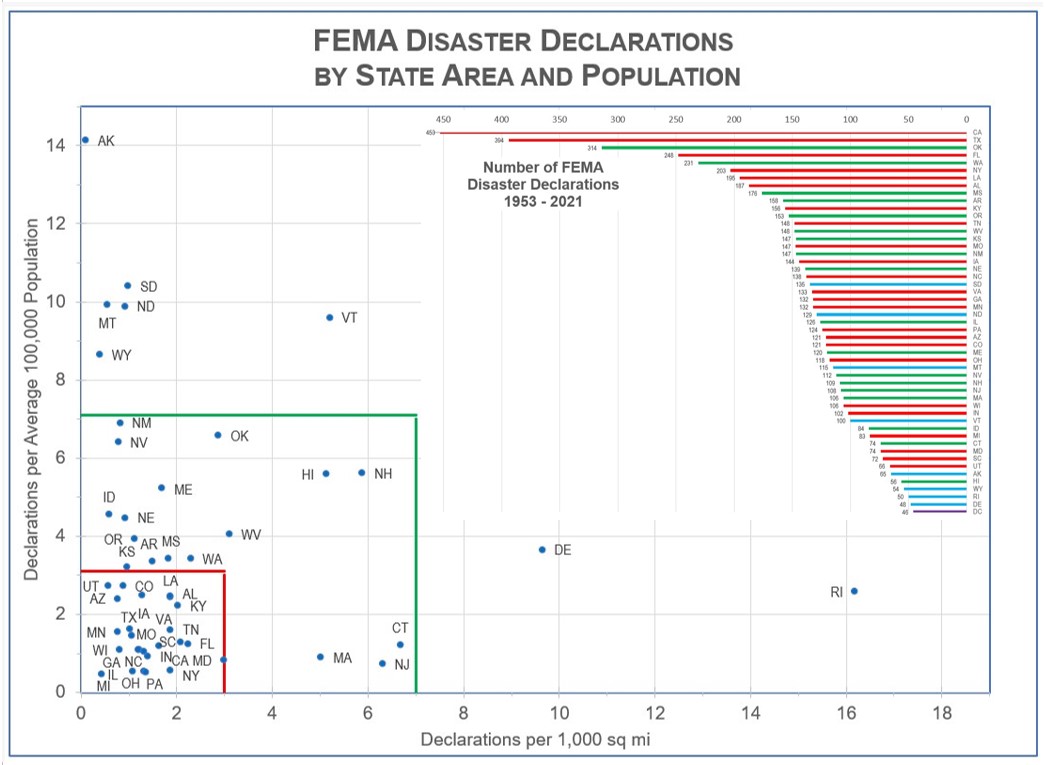
For the States with the most disaster declarations since 1953—CA (453), TX (394), OK (314), FL (248), WA (231), NY (203), LA (195), and for comparison, PA (124), and DC (46)—the following graph shows the cumulative number of disaster declarations and the proportions of the declarations attributable to the five categories of causes.
CA and TX have by far the most disaster declarations, averaging over five per year. This is not surprising given their sizes and populations, however their rates of declarations is also increasing far faster than any other State.
OK is not too far behind CA and TX in disaster declarations, averaging over four per year. FL, WA, and NY have averaged over three declarations per year. LA, AL, and MS have had over 150 declarations in 68 years, averaging about two per year. For comparison, six States—UT, AK, HI, WY, RI, and DE—average less than one declaration per year.
The causes of disaster declarations in the nine States illustrates a familiar pattern. Wildfires dominate on the western side of the country; weather-related events dominate on the eastern side of the country. TX and OK seem to be where fire and rain meet.

So the next time you have a few moments, go to the FEMA website, enter your zip code, and learn about the times (before COVID) that you were part of a Federal disaster Area.
