Medical testing is the foundation for any response to the Coronavirus crisis, on both an individual and a societal level. When you get a medical test, whether it’s for pregnancy, drugs, or Covid-19, there’s a chance that the results will be incorrect. It’s a matter of biochemistry and statistics. Without knowledge of the prevalence of the disease in the population, test results cannot be interpreted unambiguously. The ways our government and society have reacted to the infection has made the collection of quality data and their interpretation problematical if not impossible.
There are Many Tests
There are two general types of tests for Covid-19 — genetic tests and antibody tests. Genetic (AKA viral or molecular) tests detect active infections from nasal swabs. They cannot tell whether someone has had the infection and has since recovered. Antibody tests (AKA serological) detect antibodies in the blood from a past infection.
The Johns Hopkins Center for Health Security reports that, as of June 2020, there are 37 antibody tests for Covid-19 that have been approved for diagnostic use in the United States, 18 tests that have been approved for diagnostic use in other countries, 29 tests that have been approved for research or surveillance purposes only, and 36 tests that are still in development. The U.S. has developed (or is developing) 27 of the antibody tests, including 2 with China and 1 with Switzerland. China has developed 7 tests on its own. Germany, Finland, and South Korea have also developed a test. Thirty companies have developed (or are developing) these tests. Siemens Healthcare Diagnostics Inc. has six tests, and InBios International, Inc. and Beijing Wantai Biological Pharmacy Enterprise Co., Ltd. have two tests each.
Each of these tests has different performance characteristics. Genetic tests are highly capable of detecting an infection so long as the swab effectively collects the virus, however, they can indicate infections where there are none. Antibody tests may indicate an infection has not occurred when it actually has but it is unlikely to miss an infection that has occurred. Using both tests, in sequence, is considered an effective strategy. Patients who receive positive detections on genetic tests are retested with antibody tests to control the possibility of false results.
It is, of course, more complicated. If a test is done too early in the disease progression, there may not be enough of the virus or enough antibodies to be detected by a test. Furthermore, biological differences between individuals may influence the probability of a false result. Some individuals may be more likely than other individuals to have a false positive or false negative result. It’s the Harvard Law—under the most carefully controlled conditions of light, temperature, humidity, and nutrition, a biological organism will do as it damn well pleases.
Tests Aren’t Equally “Good”
Why do we need 37 tests; shouldn’t just one suffice? That’s true in an ideal world, tests should be 100% accurate, but in the real world of complex biochemistries, they aren’t. No test is perfect. They all produce errors.
There are two concepts that characterize a test’s performance ability. Unfortunately, the concepts go by many terms:
- Ability of the test to detect an infection. This is called the test’s sensitivity or its True Positive Rate (TPR) or its probability of detection. It is the tests’ ability to avoid false positive results. The false positive rate (FPR)is the probability that the test will produce an incorrect positive result. Sensitivity equals 100%-false positive rate. TPRs tend to be above 90%; FPRs tend to be below 10%.
- Ability of the test to detect the absence of an infection. This is called the test’s specificity or its True Negative Rate (TNR) or its probability of nondetection. It is the tests’ ability to avoid false negative results. The false negative rate (FNR)is the probability that the test will produce an incorrect negative result. Specificity equals 100%-false negative rate. TNRs tend to be above 80%; FNRs tend to be below 20%.
Genetic tests tend to have high sensitivities but lower specificities. Antibody tests tend to have lower sensitivities but higher specificities. A test’s ability to avoid false positive errors and false negative errors, that is. the rate of correct test results, is called the test’s accuracy.
Results May Not Mean What You Think
Sensitivity and specificity are statistics that characterize diagnostic tests. Predictive Value is a statistic that characterizes test results. It is based on test sensitivity and specificity, and incorporates the rate of infection in the population being tested. It is calculated using Bayesian statistics. Positive predictive value (PPV) is the probability that a positive test result really is positive. Negative predictive value (NPV) is the probability that a negative test result really is negative.
In traditional statistics (called frequentist because probabilities are based on frequencies), the probability that a positive test result is true is the sensitivity or TPR. Another way to interpret test results, though, is through Bayesian statistics. Bayesian statistics allow other knowledge of conditions to modify the frequentist estimate of probability. To interpret Covid-19 test results from a Bayesian perspective, you must know 3 things:
- The false positive rate for the test or the test’s sensitivity
- The false negative rate for the test or the test’s specificity.
- The percentage of people in the population who have the disease, called the prevalence.
The Bayesian probability that a positive test is correct (i.e., you have the infection and the test says so) is equal to:

The following chart shows the Bayesian probability that a positive test truly indicates the presence of an infection, for five combinations of sensitivity and specificity, over a range of prevalence rates in the population. In the chart, the vertical axis represents the calculated Bayesian probability that a positive test is correct, that is, the PPV. 100% on the vertical axis means all the tests are likely to be correct. The horizontal axis represents the prevalence of Covid-19 in the population (whatever the population might be). The prevalence axis ranges from 0% to 25%. One study found prevalence rates from 0.222% to 47%, mostly below 4%. The five curves represent tests with different sensitivities and specificities. The red line at the top of the plot represents a near-perfect test having a sensitivity and a specificity of 99.99%. The probability of such a test providing correct positive result would be 100% unless the prevalence was below about 2%. The yellow line at the bottom of the plot represents the test with the lowest sensitivity (84%) and specificity (64%) reported by the Johns Hopkins Center for Health Security. The probability that a positive result on this test is correct is only 10% if the prevalence is as high as 5%. The remaining three lines represent tests having sensitivities and specificities of 90%, 05%, and 98%.
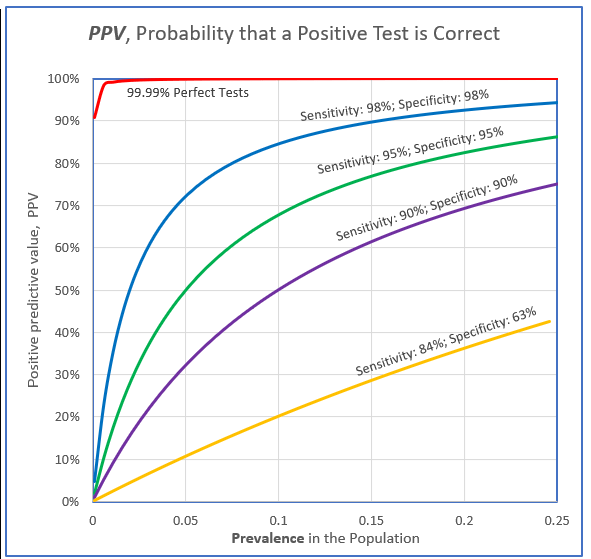
What the plot shows is that even the best tests available, with sensitivity and selectivity over 98%, will provide incorrect positive results in almost 20% of cases if the prevalence of the infection in the population is less than 5%. Half of the positive test results will probably be false if the prevalence in the population is 1%. In general, the rarer the disease is in the population, the lower the probability that a positive result indicates a real infection, despite a test’s high sensitivity. This means that many people who test positive for Covid-19 may not have the infection after all. Stories of spontaneous recoveries after a positive test result may actually be a reflection of imperfect tests. On the other hand, if you are in a captive population where the prevalence is high—like a prison or nursing home—your positive results are likely to be correct.
And it gets even more convoluted.
Covid-19 tests are not readily available, unlike, say, pregnancy or drug tests. Not everyone who wants or needs a test can get one. People who have Covid-19 and people who don’t have Covid-19 are not equally likely to be tested. Consequently, data on the rate of infection in the population doesn’t apply to all the people in the country (or other demographic), but rather, applies only to the people who took a test. They constitute the population. Furthermore, another assumption is that the tests of the individuals in the population are independent of each other. This is certainly not true. Some individuals—politicians, celebrities, medical professionals, professional athletes, wealthy elites—are tested repeatedly. The prevalence in the population may actually be much different than is estimated because of the replicate testing. Without more complete data, there is no way to correct for these duplicate tests.
The Testing Conundrum
No Covid-19 test is perfect but most are pretty good, at least when their performance is evaluated under controlled conditions. Even under the most carefully controlled conditions, individuals present unique challenges to testing. This introduces uncontrolled variation into results. The lower the rate of infection in the population, the lower the probability that a positive result indicates a real infection. Consequently, it is essential to know the rate of infection is in the population. Testing resources are limited so they cannot be applied throughout the population when sought. This means the population being tested is not the same as the general population. Furthermore, tests are repeated on preferred individuals so that testing is neither unbiased nor independent. Therefore, statistics used to characterize results in the population may be misleading. This is a conundrum.

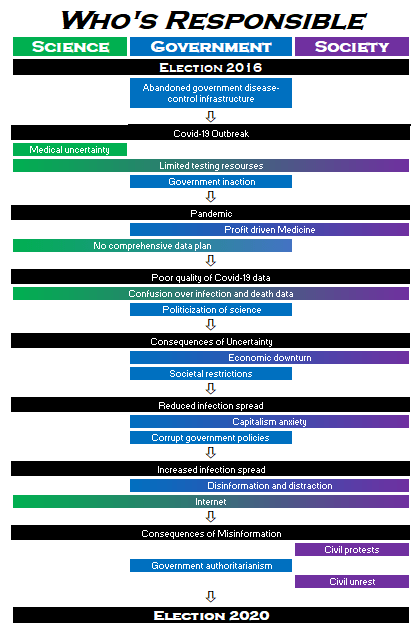
The first steps in solving any problem are to acknowledge it, define it, and understand the context in which it occurs. Most people don’t recognize that Covid-19 testing is problematical. Some do but don’t understand the details. Only a few recognize how the actions of government and society are exacerbating issues involving covid-19 testing, and as a consequence, the pandemic itself. At a time when there is so much information (and misinformation) available about the virus, it is paradoxical that our understand of issues involving testing, the very foundation of any solution to the pandemic, are so lacking.